Jack Belluche, Ford Johnstone, Alex Brockman
Jack BellucheBlockedUnblockFollowFollowingDec 5
Donald Trump is the first President to actively use Twitter during his presidency. With over 55.6 million followers, and news networks hungry to report on anything he says, his tweets are exposed to a vast audience. He may have influence on people and how they think, but can he influence the stock market as well? Thats what we wanted to find out.
For our final project, we wanted to see if we could predict the change in the stock market after Trump tweets. Lucky for us, Trump has really upped his Twitter game and tweets almost half a dozen times a day, giving us plenty of data to work with.
Get the Data
To analyze his tweets, we first had to create a dataset. We started out by using Tweepy, an open-source python library, to call the Twitter API and collect Trump’s tweets. Right away we ran into a problem. The Twitter API limits users to only the most recent 3200 tweets and Donald Trump has over 35,000 tweets. Things were looking grim.
We considered using Beautiful Soup to gather Trump’s tweets by scraping his Twitter web page. This would have been a very lengthy process. Lucky for us, we found a website www.trumptwitterarchive.com, which had already accumulated all of Trump’s tweets for us. This expedited our project as scraping the web for all 35000+ tweets and parsing and formatting the data would have taken a significant amount of time.
With our newfound dataset, we could start analyzing the data. From trumptwitterarchive we were able to convert all of his tweets into a nice, and easy to work with, CSV format; however, we ran into issues with the encoding of the data and decided to download it in JSON format, which worked seamlessly. We used a Jupyter notebook to analyze and format the data, and loaded the data into a pandas DataFrame, which made manipulating and pulling specific data straightforward.
Analyzing the Data
We wanted to use the overall opinion of the tweet, whether is is positive, negative, or neutral, along with other factors like the state of the market, to try and predict a rise or fall in the S&P 500 immediately after Trump tweets. Sentiment analysis would be perfect for this! We used a combination of the Natural Language Toolkit and Afinn libraries to come up with a sentiment score for each tweet. A positive score if the overall tweet has a positive connotation and a negative score for a tweet with a negative connotation. A sentiment score at or around zero is considered to be neutral.
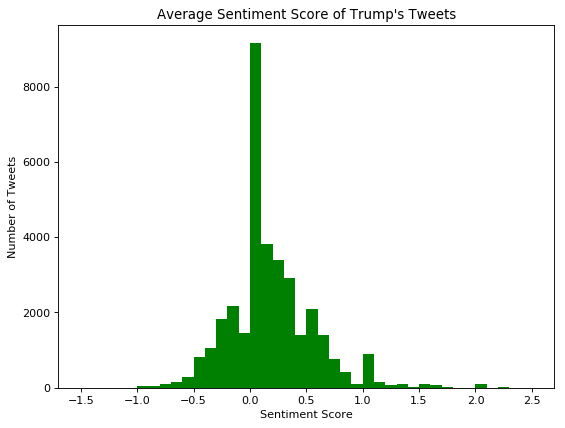
After running our analysis over all 35000+ tweets, we can see that the majority of tweets had an average sentiment score at or around zero. We attributed this mainly to the short length of the tweets. We removed certain “stopwords” which included words like “I”, “me”, “this”, “that” and other words that don’t convey any sort of meaning. We do see plenty of tweets that have positive sentiment and plenty of tweets that have negative sentiment, which is good for training our model.
Two other features we wanted to look at were the time of the tweet and the day of the week the tweet was sent on. To do this we converted the time stamp from our initial data, that we pulled from the website, and converted it to a pandas’ timestamp, which was easier to work with. These were the results when we graphed each day of the week:
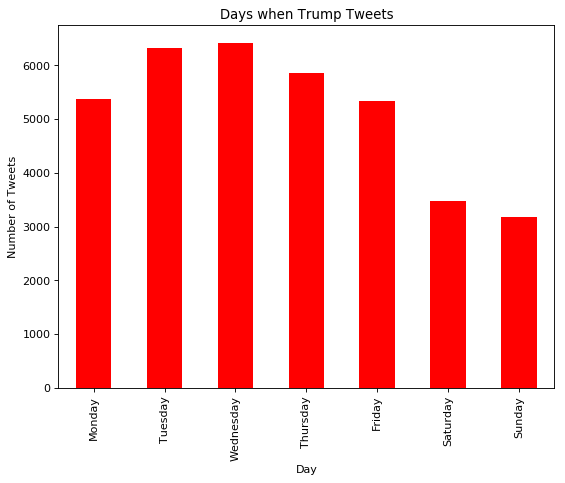
Looking at the graph we can see the majority of tweets occur from Monday through Friday, which is good for us because that is when the stock market is open. On these days, the market opens at 9:30 EST and closes at 16:00 EST, a small window of time compared to the rest of the day. Here is a graph depicting all the tweets and the hour when they were tweeted.
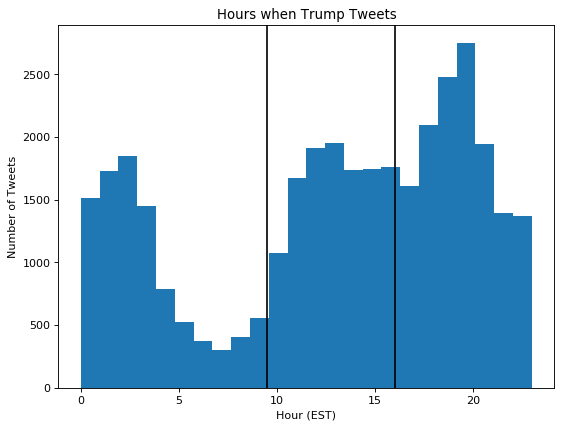
The lines on the graph represent the open and close times for market. As we can see there is a sizable chunk of tweets that fall in this range, which means we’ll have enough data points to train our models.
Now that we had our sentiment score for each tweet, we could move on to analyzing them in a market environment. To get data on the S&P 500, we used Quantopian, an open source hedge fund, who provided the data through the use of their research environment. Luckily, their environment is very similar to a Jupyter notebook, but some functionality is restricted in order to restrict users from pulling data out of their environment. We had to upload our own CSV files and pull our data from there because they didn’t allow reading data from github. We gathered minute by minute spot prices on the SPY ETF which actively mimics the holdings and price movements of the S&P 500 market index, and went off to work.
Modeling
To test our hypothesis that Trump’s tweets do affect the market and we can predict a change in the SPY ETF, we trained three models. One RandomForest model, one AdaBoost model, and one KNearestNeighbors model. These models all classify the data into discrete labels. For our classification labels, we had the number 1 represent a price increase of greater than $0.10, the number -1 represent a price decrease of more than $0.10, and 0 if the price change stayed in between that range.
Our input consisted of four main parts. The sentiment score of the tweet, the time of the tweet, the day of the tweet, and the momentum of the market calculated over the past fifteen minutes,. The time of the tweet was subclassified into four different categories, morning, before_noon, after_noon, and late_afternoon. We used one hot encoding so time was represented by four columns. The day of the tweet was also one hot encoded by having columns for Monday through Friday. Overall our input had dimensions of 1×11.
We split our data into 80% train data and 20% test data. For each model we trained it and tested it ten times and took the average accuracy for each model to see which model performed best overall. After all of our testing, we found that AdaBoost performed the best with an average accuracy of 72.4%, which is particularly good. The average precision for this model was 58.5% and the average F1 score was 61.4%. The RandomForest had an average accuracy of 61.8% and KNN had an average accuracy of 67.6%. We were quite pleased with the success of our models, but we wanted to know if there was a better way to measure the sentiment of a tweet. Not to fear, Emojis are here!
EMOJIS
In class we looked at DeepMoji, a neural network that takes in tweets as its input, tries to understand the meaning and opinion of the tweet, and matches certain emojis to that tweet. An angry or negative tweet might have the angry face emoji, and a happy or positive tweet might have the ear-to-ear smile emoji. DeepMoji was trained on millions of tweets which means it can pick up on sarcasm and other emotions that basic sentiment analysis can miss. Here’s a picture of the network with all the layers:
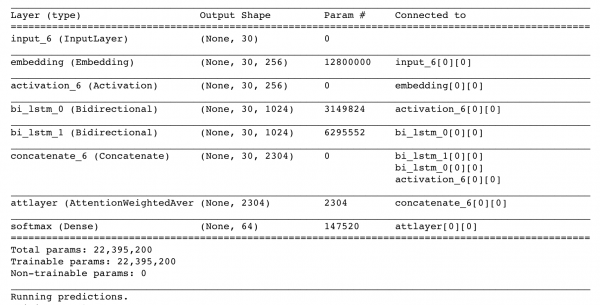
We wanted to use this pre-trained network and apply it to Trump’s tweets and see if this would give a better sentiment understand than just a simple sentiment analysis algorithm. (Big thank you to Ulf for this idea!) So that’s what we did!
But first, we wanted to look at Trump’s tweets and make a wordcloud to see what words he tweeted the most.
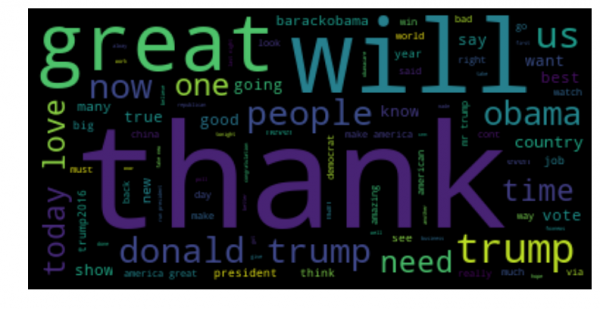
A lot of “Thank you” by the looks of it. Some other notable ones are “Obama”, “great”, “people”, and “big”.
We cloned the DeepMoji repository onto our machine and used some of their included examples to parse the tweets and feed them into the neural network. Luckily, the team behind DeepMoji included the pre-trained weights so we didn’t have to start the model from scratch. The neural network produces a list of 64 emojis and a confidence level for each emoji on how well it fits the tone of the tweet.
We went through all of the tweets and found the top five emojis before and after Trump became president.

These are the top five emojis before Trump was president. The number on the bottom represents how many tweets had this as the number one emoji associated with the tweet.
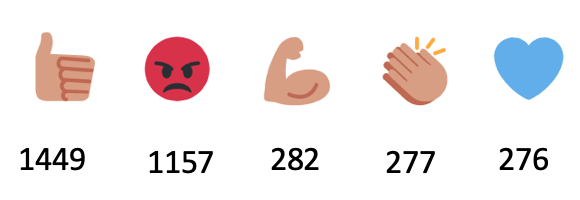
These five are the most used after Trump became president. There is not much difference between before and after, but we believe the emojis show that Trump is very expressive.
After passing every tweet into the neural network, we took the top five emoji values, which were 0 through 63, the probability for each emoji, and the overall confidence of the emojis, which was the sum of the individual emojis confidence level, and passed those into our models. Our models and classification labels stayed the same in order to accurately compare the two sets of models. The RandomForest model had an average accuracy of 61.6%, the AdaBoost had an average accuracy of 72.6%, and the KNearestNeighbors had an average accuracy of 67.7%. Pretty surprising! The accuracy of the two sets of models is almost exactly identical.
Conclusion
So what can we take away from this? Even though our most successful models produce accuracies around 72% we still need to backtest these models to see how they would actually perform in the real world. If most of the success rate comes from the model predicting zero change then that will not help us because we will not buy or sell shares of SPY if the model says there should be little to no movement. By backtesting this in the Quantopian environment, we can see how our model would have performed in the actual market without us having to put up our own capital to make trades. If the model maintains a 72% accuracy across predictions for market upturn and downturn, then it has the potential to make a lot of money.
To increase the accuracy, many more factors can be included in the training of the model. However, more features requires more data points in order to make a complete and reliable model. Too few data points and you won’t have an accurate model.
But do Trump’s tweets affect the market? Definitely. Do Trump’s tweets significantly affect the market? Probably not. That’s why we only looked at short term changes. Trump is an extremely successful business man and the President of the United States, so he does have at least some influence over how people think. Our model tries to predict what those people do. Hopefully we get it right!
We hoped you liked our post. To see our code and datasets, click here. Big thank you to the MIT Team who made DeepMoji, which made our project possible. Here is the link to their repository.
Cheers!





Connect with us