


There are a lot of problems with the United States.
For a start, the country’s government is run by a man who seems to believe everything he’s told at all times. But it goes beyond that — Trump and his administration are a symptom, not a cause. The demography of the USA is rapidly changing, and this is very slowly causing seismic political shifts.
Democrats are fond of pointing out that the Republican Party has won a majority of the presidential primary vote only once in thirty years. That statistic is correct — George W. Bush did win a majority in 2004, but in 1992, 1996, 2000, 2008, 2012 and 2016 the Democratic candidate (Bill Clinton, Al Gore, Barack Obama and Hillary Clinton) were clear popular vote victors.
Every piece of research demonstrates the same thing — white men and white women trend Republican, while every other demographic trend Democratic. In some places the vote for the Democrats among African-Americans and Latinos is as high as 90%. That population is growing to such an extent that by 2042, white people will be a minority of US citizens. This is why recent Republicans have hammered immigration issues so hard, because they know they’re less than a generation away from being a permanent minority.
Because of the conservative, white-dominated stranglehold on US politics, the soon-to-be-minority have doubled down on attempts to maintain their power. Most of the time this is through voter suppression and gerrymandering, and it works. More than 200,000 African-American voters were wrongly removed from the rolls in Georgia; had they voted, the Democratic candidate for Governor, Stacey Abrams, would have received about 180,000 of those votes; as it was, she lost by fifty thousand or so.
Proposals for change to the US electoral system, or the political system, usually come from progressives, anxious for the result of elections to accurately reflect the democratic will of a demographically diverse country. Such proposals usually include abolishing the Electoral College, term limits for Senators and Congressmen, or a national body to oversee elections. But recently, after the 2018 midterms, my attention was caught by a meme, shared on Twitter (sadly, I have been unable to find the original; if anyone does, I will of course credit the originator). But it looked something like this:
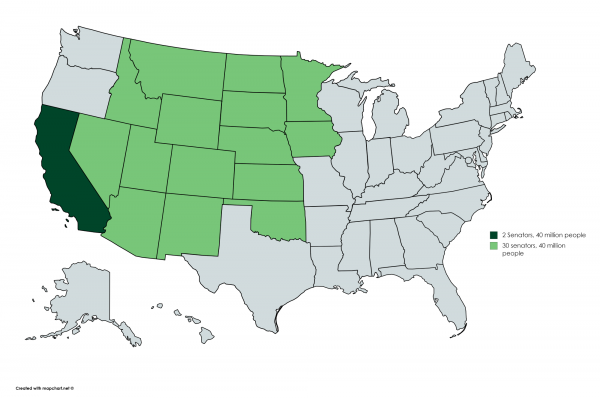
The meme points out that the population of California (some 40,000,000) are represented by 2 senators out of 100, while the populations of 15 other states (totalling about 40,000,000) are represented by 30 senators out of 100. This is undeniably the case, and it comes as a result of how the US government was put together. The equal representation of each state came out of the Connecticut Compromise, a proposal by Roger Sherman and Oliver Ellsworth, Connecticut’s delegates to the Constitutional Convention of 1787. The Compromise was just that — a deal struck between delegates of smaller states like Connecticut and Rhode Island, and larger ones like Virginia and Pennsylvania. The idea was that each state have equal representation in the Senate, to prevent the larger states from overwhelming the smaller, but that their influence in the House of Representatives would be proportional to their population. To this day seven states — Alaska, Delaware, Montana, North Dakota, South Dakota, Vermont and Wyoming, have only one Congressman but two Senators. This model was followed, incidentally, when the Australian constitution was written, leading to the situation in which Tasmania has five federal MPs but twelve Senators.
The originator of the meme didn’t make any suggestions as to how this nexus is to be avoided. After all, it’s there for a reason. If the Senate was proportioned like the House, California would have a full 20% of its membership. Given how most of the large states, apart from Texas, are reliably Democratic, you can see why the Republicans and the white population who support them are so resistant to any kind of change there.
The meme got me thinking — what if there was a middle ground? What if each state received two senators, but all 50 states had a roughly equal population. Would this make the results of elections more democratic, and more to the point, would it make them more Democratic? I decided to find out.
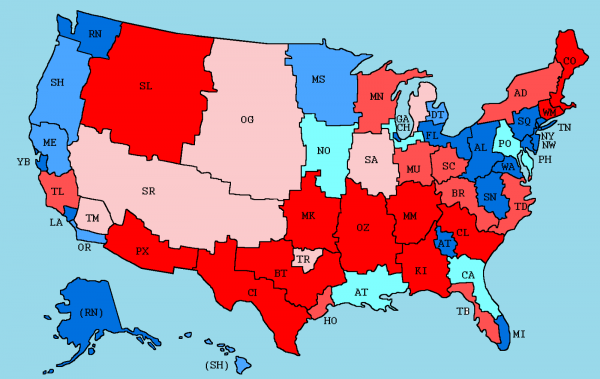
The first step was to determine how these hypothetical states would be divided. Fortunately, someone did the work for me there. This map, from Neil Freeman, used 2010 census data to divide up the 308 million (ish) Americans into fifty new states, each with around six million inhabitants. As you can see, it creates some very different borders. New York City, Los Angeles and Chicago would be states on their own, while Atlanta, Miami, Philadelphia and Houston would include some more regional areas but be dominated by their cities.

The Plains would only have a small number of states, and California would be six whole states by itself. About 63% of Americans live in cities, and the divide between urban and rural Americans is increasingly apparent when you look at voting statistics. Almost all the very large American cities are reliably Democratic voting. Almost all the regional and rural areas are reliably Republican. Some exceptions, such as Detroit (with its very poor economy) exist.
The next thing to do was to get all the county voting statistics. I wanted to know what the electoral map would look like if these were the fifty existing states. The best way to know that was to look at county votes, since 49 of the 50 states record their votes at the county level. Alaska doesn’t, but fortunately on Freeman’s map the entirety of Alaska is contained within one state, so it doesn’t matter.
I set about creating a spreadsheet with the vote totals for each US county, of which there are 3,142. In Louisiana, they are called Parishes, and in Virginia some local city governments have the same function. I gathered those statistics for four different elections — the 2016 presidential election, the county’s most recent gubernatorial election, and the county’s two most recent senate elections. Two most recent because each state elects two senators. I only recorded the Democratic and Republican vote, except in a few cases. Vermont and Maine both have Independent senators, but they caucus with the Democrats so I counted their votes as Democratic. In California, the ‘open primary’ system means that several elections have been held between two Democrats, including the two most recent elections for the Senate. In this case, I counted the vote against the Democratic opponent in 2016 and 2018 as Republican. This doesn’t quite work because the 2016 runner-up, Loretta Sanchez, was a conservative Democrat but Diane Feinstein’s opponent, Kevin De Leon, ran to her left. In any case, I assumed a bulk of their votes would have come from Republicans who wanted to vote out the incumbent, and it doesn’t affect the result too much, as you’ll see.
The next step was to try to recreate Freeman’s map at the county level. This was difficult, because some counties have very high populations and some very low, and to even out the population, Freeman would have had to split some counties up. I decided to go as close as I could but keep every county intact, so my map is not identical, but similar.
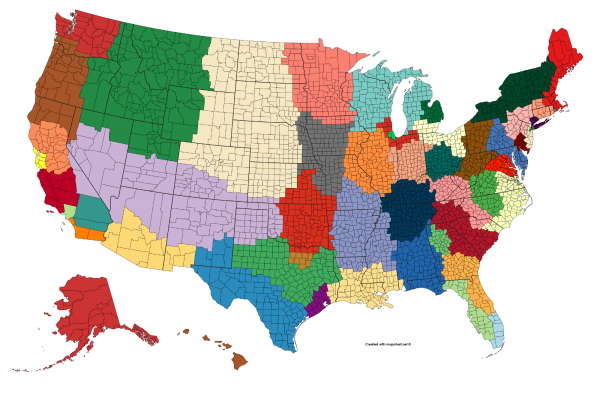
The tool I used for this is the amazing Mapchart, which I could (and have) play with for hours. Some states on my map, like Temecula in southern California, are much smaller by population than on Freeman’s, but it works as a general principle. After some debate with myself I decided to include the District of Columbia in the State of Washington as Freeman did, rather than keep it separated out. Again, this wouldn’t affect the experiment too much anyway.
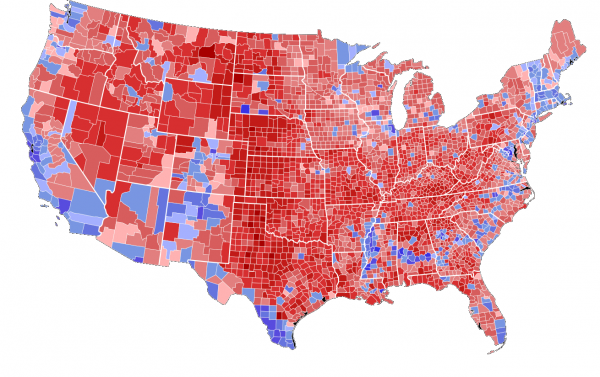
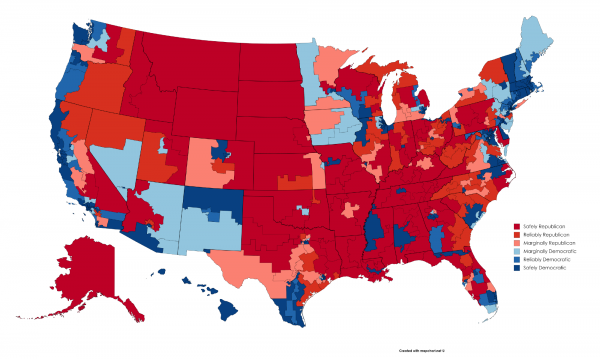
For comparison, this is the 2016 presidential election vote by county.
So now it was time to put this all to the test. If each state was equal in population, would it favour the Democrats?
Trump v Clinton
Under the Electoral College system, each state receives a number of college votes based on its population — the total number of representatives in Congress. So California, which has two Senators and 53 Representatives, has 55 Electoral Votes, while Delaware has three. The District of Columbia also has three, even though it is unrepresented in Congress (it elects a non-voting delegate).
If each state’s population were equal, they would also have an equal number of electoral votes. There might be variance one way or the other, but since each state’s population would be roughly the same, the winner of a presidential election would probably be the one who won the most states, no matter what those states were. If the state populations were equal, each state would have about 6.2 million residents, about the same as Missouri (which has 10 electoral votes)
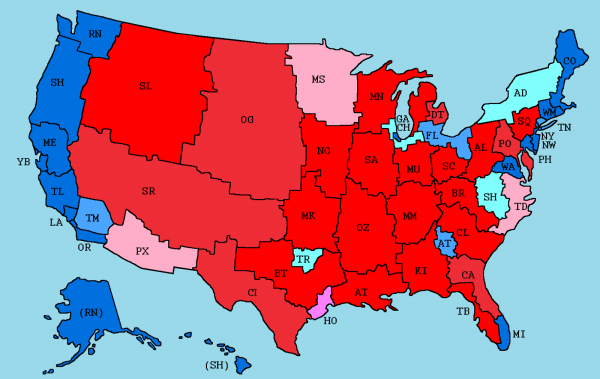
Here’s what the map looks like with the 2016 results. Not a single vote has changed — every county, every voter, votes exactly the same way. Only the state borders change.
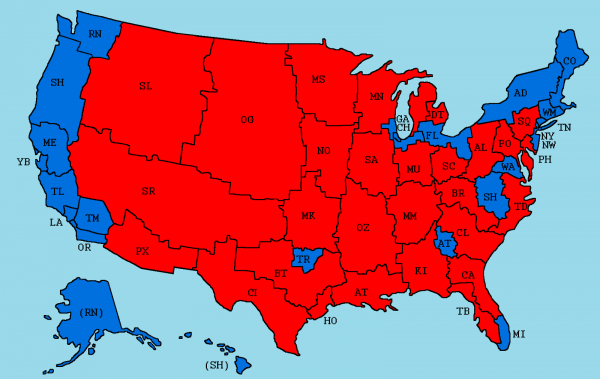
Under this map configuration, Trump would have won 27 states to Clinton’s 23. More than likely, this would be a Trump victory, although only narrowly. This table shows the 10 closest states under this configuration:
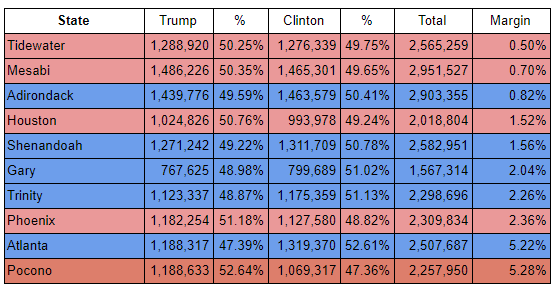
If we consider a margin of 5% or less winnable, that means these states would be the ‘swing states’ in which the election was mostly fought. If you look at the locations, it includes Virginia and the coastal Carolinas, Minnesota, upstate New York, the big Texas cities, the Southwest and industrial Pennsylvania. Many of these areas are where Trump did unusually well. Similarly, Trump captured Pennsylvania, Michigan and Wisconsin, states which are more usually in the Democratic column. This indicates how Trump won — his appeal to blue-collar voters in industrial areas hit hard by economic factors has been well-documented.
In the actual election, there were twelve states with a margin under 5%, of which Trump won seven. One thing we can extrapolate here is that there would be fewer ‘battleground’ states, but they would be in similar areas.
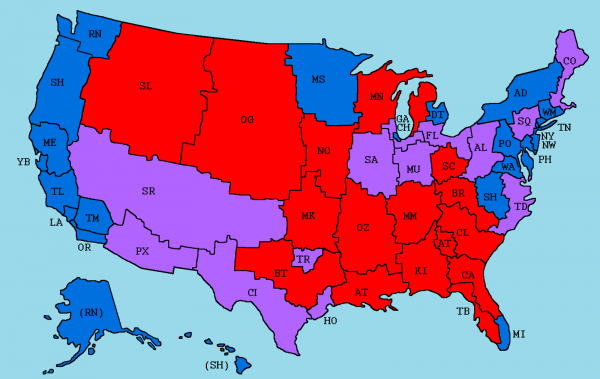
This map shows the relative Democratic vs Republican strength in each of these fifty equal states. The divide is quite clear when looked at this way and along county lines — rural voters vs urban voters. The vote for Clinton in America’s three largest cities — New York, Los Angeles and Chicago, was between 75 and 85 percent. The strongest red state on this state is Mammoth, which corresponds to northern Alabama and Kentucky, two of the most pro-Trump states.
Compare this to the strength of each candidate by county:
So, we can extrapolate that the unequal populations of the states wouldn’t necessarily make the country more likely to vote Democrat, although it would certainly be possible for a Democratic candidate to win in a landslide. I’m aware, of course, that this isn’t the only way you could divide the nation into fifty equal portions. But I think it does show that the population of the states, and the electoral college distribution, wasn’t the most crucial factor in deciding the outcome of the 2016 election.
The Senate
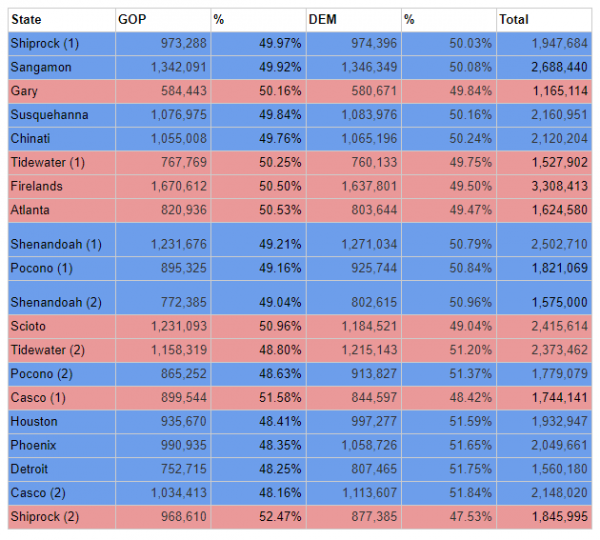
The original meme is about the Senate, so let’s look at the Senate under this system. Does the large disparity in population between California and Wyoming benefit the Republicans? The answer is…not really. Take a look at this map, which shows what the Senate would look like. This is taking into account the two most recent Senate elections in each county — for many, that was this year’s midterms, for others 2014 or 2016, or the special election in Alabama in 2017.
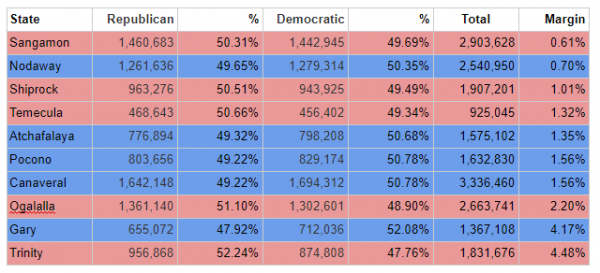
With this configuration, there would be 51 Democrats in the Senate and 46 Republicans, plus two Independents who caucus with the Democrats. That 53–47 margin would be a solidly blue Senate, but there’s an important caveat here. The last time the Democrats controlled the Senate they had 56 senators, including the independents, so it’s possible for the Democratic Party to control the Senate already — this configuration might help them a little, but it doesn’t create a massive advantage. Some of the seats here would be very competitive; here’s the ten most marginal seats:
Some of these seats would be very winnable by both sides, but would have trended Democratic in the recent midterms. A significant national trend towards either party would probably deliver them Senate control, even if the number of people in each state was the same. At the 2020 election, there are four or five seats that are very winnable for the Democrats, especially if the ‘blue wave’ continues and a Democratic president is elected. That would give them a strong Senate majority, probably on top of their House majority as well.
For comparison, the strongest Democratic states would be Yerba Buena (San Francisco), Los Angeles, New York, Chicago and Washington, all of which would record a 70% or higher vote for the Democratic candidate (in Yerba Buena this would be close to 90%). Only one state, Muskogee, would record a Republican vote that high, but they would be over 60% in a dozen or so races. 20 of the 53 Republican senators in the upcoming 116th Congress (from 3 Jan 2019) won their last election with more than 60% of the vote. Of the 47 Democrats (and their independent allies), 14 received that level of support (16 if you include both California senators, who both ran against another Democrat).
So what we can tell from this map is that it’s not the population distribution causing Republicans to control the Senate. Republicans would still win in rural areas, and while each state would be equal in population, in many of them the absence of a large city would favour the GOP, and the votes of the urban areas they have wouldn’t necessarily counter it. Democrats can win the Senate under the present state arrangements. It’s just that recently they haven’t.
Governors
A lot of the day-to-day decisions that affect American lives are taken in their state capitol, not Washington. When it comes to electing state Governors, there are reliably blue and red states, just as there are with Senators and Presidents. A Democrat hasn’t won the governor’s office in Alabama since 1998, Florida since 1994, Texas since 1990, and South Dakota since 1970. Similarly, a Republican hasn’t been elected as governor in Oregon since 1986, Delaware since 1988 or Washington since 1984.
I took the results of the most recent gubernatorial election in each county, and this was the result .
Some of the margins in these equal states would be, just like with the Senate and Presidential results, extremely high. For instance, in New York, which is the five New York City boroughs (each of which is a county) the vote for the Democratic candidate in November (incumbent NY governor Andrew Cuomo) was 85%, compared to only 15% for Republican Marc Molinaro. Statewide, Cuomo still won in a landslide (58% to 36%) but not that big a landslide. In 2017, NYC mayor Bill di Blasio won 66% of the vote. If these five counties were their own state, they’d never elect a Republican to any office based on these figures; conversely, upstate New York is reliably Republican for the most part. New York’s status as a ‘blue’ state is due to the massive population in its largest city compared to the rest of it.
One notable anomaly here is the result in the parts of Massachusetts that make up Casco and Willimantic. Massachusetts is undoubtedly a blue state, in that it has elected two Republican senators in fifty years, and hasn’t voted for the Republican candidate for president since 1984. It does, however, have a habit of electing Republican governors, including Mitt Romney. Only one Democrat has been Governor since 1991, and the incumbent Republican, Charlie Baker, is extremely popular. So that skews that result a little — a candidate other than Baker might not do so well.
As with all the other races, the two parties would be competitive in many of these equal states. The number of Republican vs Democratic governors doesn’t really matter in terms of national politics, although it has some influence over political trends. Currently, Democrats control, or will control once their winning candidates are sworn in, 23 out of 50 states, with Republicans the other 27. With this equal states map, the division is 25 states each. The two parties would be competitive in about half of all states. Here are the narrowest margins:
Republicans would win more than 60% of the vote in four states — Ozark, Big Thicket, Salt Lake, Mammoth and King, and the Democrats would win more than 60% in six states — New York, Los Angeles, Chicago, Philadelphia, Washington, Miami and Yerba Buena (San Francisco). Since all of those except one are basically just large metropolitan areas, it highlights the strong rural-urban division I mentioned before.
Time to draw some conclusions. I think it’s obvious from this map, and from looking at the data, that it’s not the uneven population distribution that leads to Republican control. Leaving aside that Democrats can and do win control of the White House and Congress, some areas are just always going to vote one way or the other. The racial demography is a huge factor in why Republicans win so big in some areas — we know white men, and white women, are considerably more likely to vote conservative, and as long as they remain the majority, in some areas to the tune of 90%, those areas aren’t going to return Democrats. In areas where the demography is more favourable to Democrats, or in urban areas, the Republicans are at a massive disadvantage. And in some areas, such as the South, it’s voter suppression and gerrymandering causing the lopsided result in favour of Republicans.
Fifty equal states is an interesting idea. I can actually see it having some benefits. You’d have to constantly redraw the borders with every census, to keep the populations equal, but there’s no real reason you couldn’t do that. Of course this idea is fantasy, and this whole thing has just been an exercise in statistical psephology. And of course, there are more ways you could draw the borders, which might give a different result.
I can’t comment on whether equalising state populations would make election results more democratic. But it’s clear, from these results, that in the United States at least, it wouldn’t make them significantly more Democratic.


Connect with us